Nature Conservation 2020 — 25. 3. 2020 — Research, Surveys and Data Management — Print article in pdf
Records of Animals Admitted to the National Network of Rescue Stations and What They Can Tell Us

The National Network of Rescue Stations project brings, in addition to thousands of saved lives of wild animals and effective information for the education of inhabitants, also interesting statistics. The central register of all animals received not only allows the monitoring of numbers of species and individuals of injured animals and the dates and locations, but also their fate – reasons why the injury occurred, time when they were admitted, number of days spent at the station, etc. Up to 57 data items can be recorded for each animal received. The long-term uniform methodology of record-keeping also enables the monitoring of these parameters over the years.
Data summary
Overall, the rescue stations received 233,797 animals from the establishment of the National Network in 1998 to the end of 2018. Whereas, in 1998 it was 1,337 individuals, in 2018 already 23,779 individuals (increase of 1,778%) were received. The trend in the number of animals received in individual years is shown in Graph 1.
Since 2007, the National Network has kept a unified register of all animals received. Thanks to this, data on received animals can easily be processed statistically. At the end of 2018, a total of 196,987 individuals were registered in the unified register, including 1,701 reptiles (11 species), 7,301 amphibians (13 species), 114,253 birds (228 species) and 73,732 mammals (74 species). The 15 most frequently received species in the period under review are shown in Table 1. With the exception of the common buzzard, these are all species living in the immediate vicinity of human settlements, whereas the buzzard lives near human transport arteries. The order of the most common species in individual years is virtually unchanged, with the exception of the common pipistrelle and the common noctule. These species are often, but not every year, received in whole, even several-hundred-member colonies, so they are placed in the top ten, but in a very different order from year to year.
Interesting and rare species
Interestingly, of 18 species only a single individual was in the care of rescue stations in the monitored period 2007–2018:
wheatear, garganey, scarlet rosefinch, pomerine skua, Eurasian curlew, yellow-bellied toad, steppe eagle, greater scaup, red-necked grebe, black-legged kittiwake, lanner falcon, Eurasian water shrew, Alpine shrew, griffon vulture, northern gannet, European grey wolf, common redshank and common greenshank.
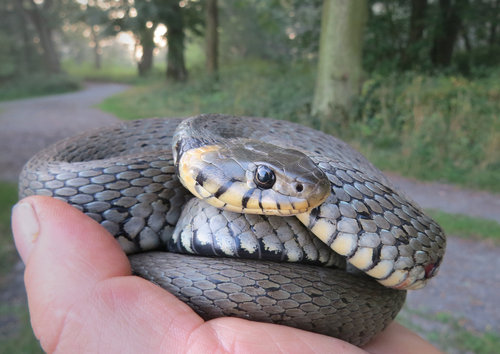
Figure 2. Reptiles also reach the rescue stations. Photo ZS Bartošovice
In terms of classification of the species into legal categories – Act No. 114/1992 Coll., on Nature and Landscape Protection; No. 449/2001 Coll., on Hunting; No. 100/2004 Coll., ‘CITES’; No. 246/1992 Coll., on the Protection of Animals against Cruelty – rescue stations received the following numbers of animals in 2007–2018, see Table 2.
What does the data indicate?
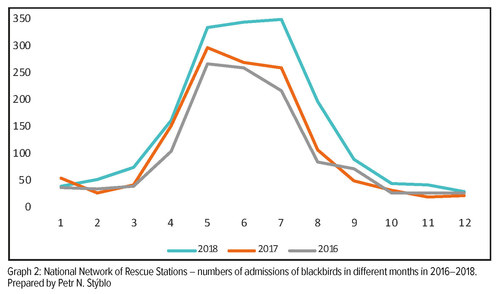
For some of the received species, the long-term statistics of the National Network allow us (with a great deal of caution) to comment on trends in the abundance of their populations in our landscape, their proximity to humans, and the emergence of a new factor that significantly affects their population. For example, Graph 2 shows a shift of maximum admissions of the blackbird in 2018 from the traditional May, when most admissions are of newly-hatched offspring, to July. It can be assumed that this shift was caused by extreme food shortages due to drought in combination with the new USUTU virus, which has primarily decimated the blackbirds since it arrived in Europe.
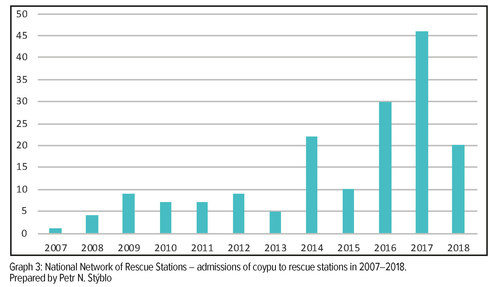
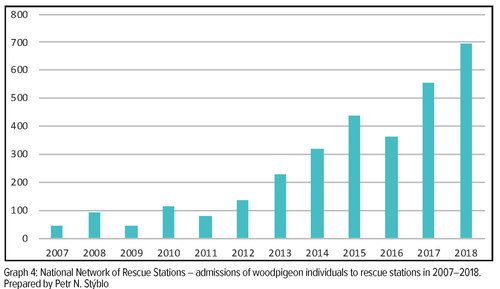
Using Graph 3, we could document the invasion of the non-native coypu (nutria). In the first half of the period, the average number received by rescue stations reached 6 animals per year. In the second half it was already 26 coypu per year, which is an increase of more than four times. Similarly (a six-fold increase) is also recorded for our native woodpigeon. Its urban population has been expanding significantly in Europe over the last decade, and this ‘migration’ towards people has also been reflected in an increase in admissions at rescue stations. This trend is illustrated in Graph 4.
Also, the admissions of the protected species Eurasian otter and European beaver may be indicative of growing populations approaching humans, see Graph 5. However, the above conclusions cannot be adopted solely on the basis of National Network statistics. These can always be taken only as a supplement to the data obtained from the wild. Moreover, it is necessary to compare them with the overall trend of increasing numbers of admissions of all animals – by 300% in the given period.
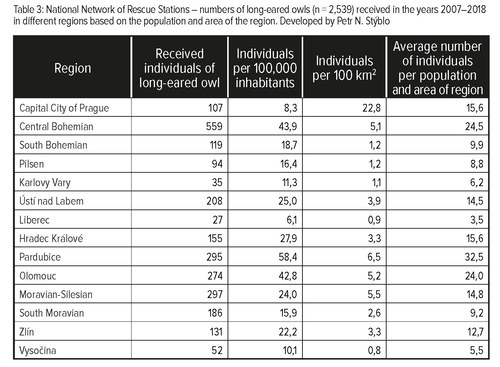
The frequency of admissions of individual species can also be monitored regionally. Table 3 uses the example of the long-eared owl. This statistic shows that the highest numbers of long-eared owls were received in the Central Bohemian Region, the lowest in the Liberec Region. In terms of the number of inhabitants, however, the highest number of long-eared owls was recorded in the Pardubice Region. On the other hand, in terms of the area of the region, the largest numbers of long-eared owls were from Prague, the lowest in the Vysočina Region. Combining both of these factors, the Pardubice Region is the richest region in terms of long-eared owls received, followed by the Central Bohemian and Olomouc Regions, and the Vysočina Region at the other end of the scale. However, the Central Register of Admissions of the National Network makes it possible to specify this statistic down to the district level.
Moreover, the admissions of individuals of each species can also be seen in terms of time – during the year. Again, using the example of the long-eared owl, it can be seen from Table 4 that the maximum of admissions during the year is almost always in the period of May to July, when the long-eared owl raises its young. However, if the winter conditions are extreme, then the peaks of admissions are partially shifted to these months – in the table especially in 2010.
Causes of admissions to rescue stations
In addition to data on animal admissions, there are also data on the causes of admissions and the further fate of animal patients in the Central Register of the National Network. The registered causes of admissions are probably the least meaningful value of the central records, because finding the cause is not always easy, as it is often a combination of several causes or one can only guess what the cause was. For example, a bird sitting on the pavement and unable to fly may be shaken by hitting a glass obstacle or exhausted due to climatic conditions or parasites. But it may also suffer from some kind of zoonosis. A bird with a broken wing on the road may not have been hit by a car, etc. Therefore, data on causes, with exceptions, such as scorched birds found near electrical equipment, predators demonstrably poisoned with carbofuran or shot animals, are taken for reference only. The reasons for admission of animals to the rescue stations of the National Network in the monitored period 2007–2018 are shown in Graph 6. In the category of young (22% of admissions), for example, the admissions of juveniles from destroyed nests, admissions of late-born young and juveniles unnecessarily captured by humans (which account for about 40% of all juvenile admissions) are included. In the category of burns by electrical equipment (2%), the admissions of live birds burned on high-voltage distribution networks are included. The category of injured animals received includes all injuries, except for young and burnt birds. Of these, about 30% are injuries caused by traffic, 25% by hitting an obstacle, 20% are animals injured by another animal. Approximately 2% of all injuries are animals injured by agricultural machinery and less than 1% are animals shot or damaged by traps.
Of course, the structure of the causes of their admission to the station varies from one species to another. The following Table 5 lists the spectrum of causes of long-eared owl admissions.
Evaluation of success
From the records we can also trace the fate of the animals received – the length of their stay in the rescue station and the way that stay ended. However, since the central register has not been able to transfer the numbers of kept animals from year to year until recently, it is difficult to follow the fate of animals differently than in one calendar year with such a large amount of data. As many of the animals are kept in the stations through the winter, the recorded data on animals in the stations have only a limited informative value during one calendar year. This can be illustrated on the data from 2018, when 45% of the animals received were released back into the wild the same year. Another 8% overwintered at the stations and most of them were released in spring 2019. A total of 36% of the received animals died or were euthanized. The success of rescue stations in the care of animals – i.e. the ratio of animals released back to nature compared to all animals received is 50–60% in the long term.
The length of time an animal stays in the rescue station depends on several factors. Of course, it depends mainly on the health and condition of the animal received, the method of treatment and convalescence, but also on the weather or time of year. For the young of many species, the advantage is the knowledge of the station staff and colleagues from the field, because they allow the young to be placed with optimal adoptive parents, which of course shortens their stay in the station. Graph 7 again illustrates, using the example of the long-eared owl, the length of its stay in the National Network’s rescue stations. Since this species is admitted to the stations mostly due to complicated injuries or as chicks from destroyed nests, it stays in rescue stations longer, an average of 39 days. In one case, an owl was successfully released after its stay in a rescue station lasting 410 days.
The above, more or less randomly selected information illustrates the vast amount of data found in the records of animals received by the National Network of Rescue Stations. The Czech Union for Nature Conservation (CUNC) as coordinator of the National Network estimates that it keeps more than 10 million records of almost a quarter of a million animals. This unique data lies unused, though it could become the basis of many scientific studies. One cannot expect the activity of rescue station workers in this respect. They are completely overloaded with work taking care of thousands of animals and communicating with tens of thousands of people who pass through the stations every year. In any case, processing the acquired data could reveal insufficiencies, differences in approaches and methodologies for animal care, which could make the actual work of the National Network and individual stations more efficient. Therefore, this article is also a call for cooperation.

Figure 3. An important activity of station workers is the protection of species
and their habitats in the field. Photo Zdeňka Nezmeškalová
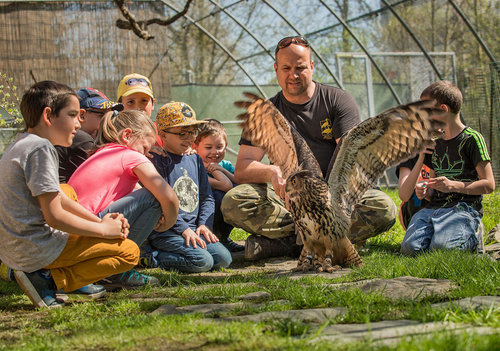
Figure 4. Environmental education DES OP Plzeň 2018. Photo Taťána Typltová


